Tree
The kissim.comparison.tree module allows to a kissim-based kinase distance matrix into a clustered kissim-based kinome tree with mean distances assigned to each branch. Different clustering methods are enabled.
This tree can be saved in the Newick format alongsite an annotation file mapping kinase names to their kinase groups and families. These files can be loaded into e.g. FigTree to visualize the kissim-based kinome tree.
Generate tree
Input file:
kissim_matrix.csvOutput file (optionally):
kissim.treeandkinase_annotations.csvClustering method:
ward(default),complete,weighted,average,centroid
[1]:
from pathlib import Path
[2]:
# Load path to test data
from kissim.dataset.test import PATH as PATH_TEST_DATA
Python API
from kissim.comparison import tree
tree.from_file(kinase_matrix_path, tree_path, annotation_path, clustering_method)
[3]:
from kissim.comparison import tree
[4]:
tree.from_file(
    PATH_TEST_DATA / "kinase_matrix.csv", "kissim.tree", "kinase_annotation.csv", "ward"
);
CLI
kissim tree -i kinase_matrix.csv -o kissim.tree -a kinase_annotation.csv -c ward
[5]:
# flake8-noqa-cell-E501-E225
PATH_KINASE_MATRIX = "../../kissim/tests/data/kinase_matrix.csv"
!kissim tree -i $PATH_KINASE_MATRIX -o kissim.tree -a kinase_annotation.csv -c ward
INFO:kissim.comparison.tree:Reading kinase matrix from ../../kissim/tests/data/kinase_matrix.csv
INFO:kissim.comparison.tree:Clustering (method: ward) and calculating branch distances
INFO:kissim.comparison.tree:Converting clustering to a Newick tree
INFO:kissim.comparison.tree:Writing resulting tree to kissim.tree
INFO:kissim.comparison.tree:Writing resulting kinase annotation to kinase_annotation.csv
Visualize tree
[6]:
import pandas as pd
import matplotlib.pyplot as plt
from Bio import Phylo
groups_to_color = {
"AGC": "red",
"Atypical": "orange",
"CAMK": "yellowgreen",
"CK1": "limegreen",
"CMGC": "turquoise",
"Other": "cornflowerblue",
"STE": "mediumblue",
"TK": "darkorchid",
"TKL": "violet",
}
kinases_to_groups = pd.read_csv(Path("kinase_annotation.csv"), sep="\t")
kinases_to_groups["color"] = kinases_to_groups.apply(
lambda x: groups_to_color[x["kinase.group"]], axis=1
)
label_colors = kinases_to_groups.set_index("kinase.klifs_name")["color"].to_dict()
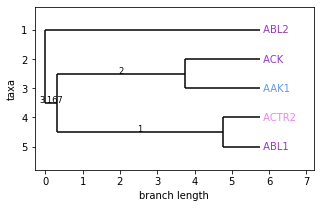
kissim_tree = Phylo.read(Path("kissim.tree"), "newick")
# Flip branches so deeper clades are displayed at top
kissim_tree.ladderize()
fig, ax = plt.subplots(1, 1, figsize=(5, 3))
Phylo.draw(kissim_tree, axes=ax, label_colors=label_colors)
[7]:
# Clean up
Path("kissim.tree").unlink()
Path("kinase_annotation.csv").unlink()
FigTree
Resources
This is a list of resources that are useful to get started with FigTree.
Tutorial videos:
Help with tip label coloring using annotations:
Download and usage under Linux
Download and unpack tgz file
Read
FigTree_<your-version>/README.txt> 3) INSTALLATIONGo to
FigTree_<your-version>/liband start FigTree withjava -Xms64m -Xmx512m -jar figtree.jar "$@"
Step-by-step guide to visualize kissim trees
File > Open >
kissim.tree> Name label: “Mean similarity” or “Mean distance”Selection mode: “Node”
Style the tree (left-side menu)
Layout
Polar tree layout (see middle button)
Optionally: Angle range
Optionally: Root angle
Appearance
Color by: “Mean similarity” or “Mean distance”
Setup > Colours > Scheme > Colour Gradient (TODO: define colors)
Setup > Tick “Gradient”
Line weight: “2”
Tip Labels (tick!)
Legend (tick!)
Optionally: Node Labels (tick!)
We can color the tip labels (kinase names) by their kinase groups in order to easily compare the structure-based clustering/tree (kissim) with the sequence-based clustering/tree (Manning).
Save kinase names and kinase groups (and other attributes) in a tab-separated CSV file
kinase_annotations.csv. In the following example below, thekinase.klifs_namenames must match with the tip labels.kinase.klifs_name kinase.group kinase.family AAK1 Other NAK ABL1 TK Abl ABL2 TK Abl ACK TK Ack
File > Import Annotations >
kinase_annotations.csvTip Labels (ticked) > Colour by > “kinase.group”
That’s it :)